Article
Continuous integration and AWS monitoring
Article
Firstly, we use SubVersion as our source control. This enables us to accurately keep track of all the changes and modifications we make throughout the development build of a website or web application. CruiseControl, or CCNet, is used to create a deployment bundle for the build and QA environments.
Each time we commit a change to our source control, CCNet kicks in, builds that solution, and deploys it to the relevant environment. If we commit a change that causes the build to fail, then CCNet will notify the Freestyle development team that something has gone wrong. This is known in the industry as Continuous Integration (or CI). The 'build' environment is updated with each change that is made by any developer working on a given project.
We use this to test new changes within the rest of the existing code, to make sure that nothing has broken in terms of functionality. The 'release' environment is a replica of a live site that gets altered in accordance with fixes, amends and updates that have been tested on the 'build' environment. Once testing on the build environment has been completed, and any identified errors have been fixed, we merge that code into the 'release branch'.
Monitoring these changes and builds involves loading up the CruiseControl page to check for any errors and such. Ideally, we want an indicator of all project statuses available at a glance.
When we moved our live sites to the cloud, we picked Amazon Web Services, or AWS, as our preferred platform. Not only does AWS allow us to code quicker and spin up a new instance with ease, but it also means we don't have to have actual, physical hardware in a co-located hosting company. Previously, if we needed to add another machine, we'd have to buy the hardware, drive to the hosting company, then install it, then configure it, and all the rest. This can take some time. With cloud-based hosting, we can simply click on the 'Create new computer instance' button, and in a few minutes, it’s ready to go. Well, it's a little more involved than that, but you get the idea – it’s much much quicker.
Amazon EC2 instances have some built-in monitoring that can be used through their CloudWatch service. On each virtual machine, we configure what we want to monitor, ie CPU usage, memory usage, disk space etc. All these metrics get stored in CloudWatch for later consumption. Behind the scenes, there is some code that runs on a virtual machine in our in-house cloud. This is configured to poll Amazon every few minutes and give us up-to-date information on all of our live environments (currently, we manage well over 200 virtual machines). This data is then passed back down to a client that renders it into an easy-to-consume, visual indication of how the sites are performing.
This same code also polls our continuous integration server, giving us stats on how the build and release code are doing. So, from just one screen, we can see both internal code deployments and health-checks on live servers. If a problem occurs, we get notified, and can quickly identify and address the issue. For example, if we notice that a server has unusually high processor usage, we can hop onto the virtual machine and take a look under the hood, as it were.
We had an issue not so long ago where one of our developers noticed one of the graphs was starting to show signs of high CPU usage - unusually high for that particular website. They quickly logged into the virtual machine to take a look, and sure enough, a task that we had scheduled to run at a certain time everyday was misbehaving. Thanks to our screens, we were able to catch it misbehaving before it impacted the stability of the site, and before either the end users or the client are aware of anything untoward. Proactive monitoring for the win!
This is our current continuous integration screen (all images in this piece have been edited to obscure any client-sensitive information):
Green means 'all good', build successful. Red means something has been committed that has broken the build, and therefore needs looking at. Amber means the site is currently in the process of being built - a developer has submitted something to source control, so CCNet has taken over, and is building the site.
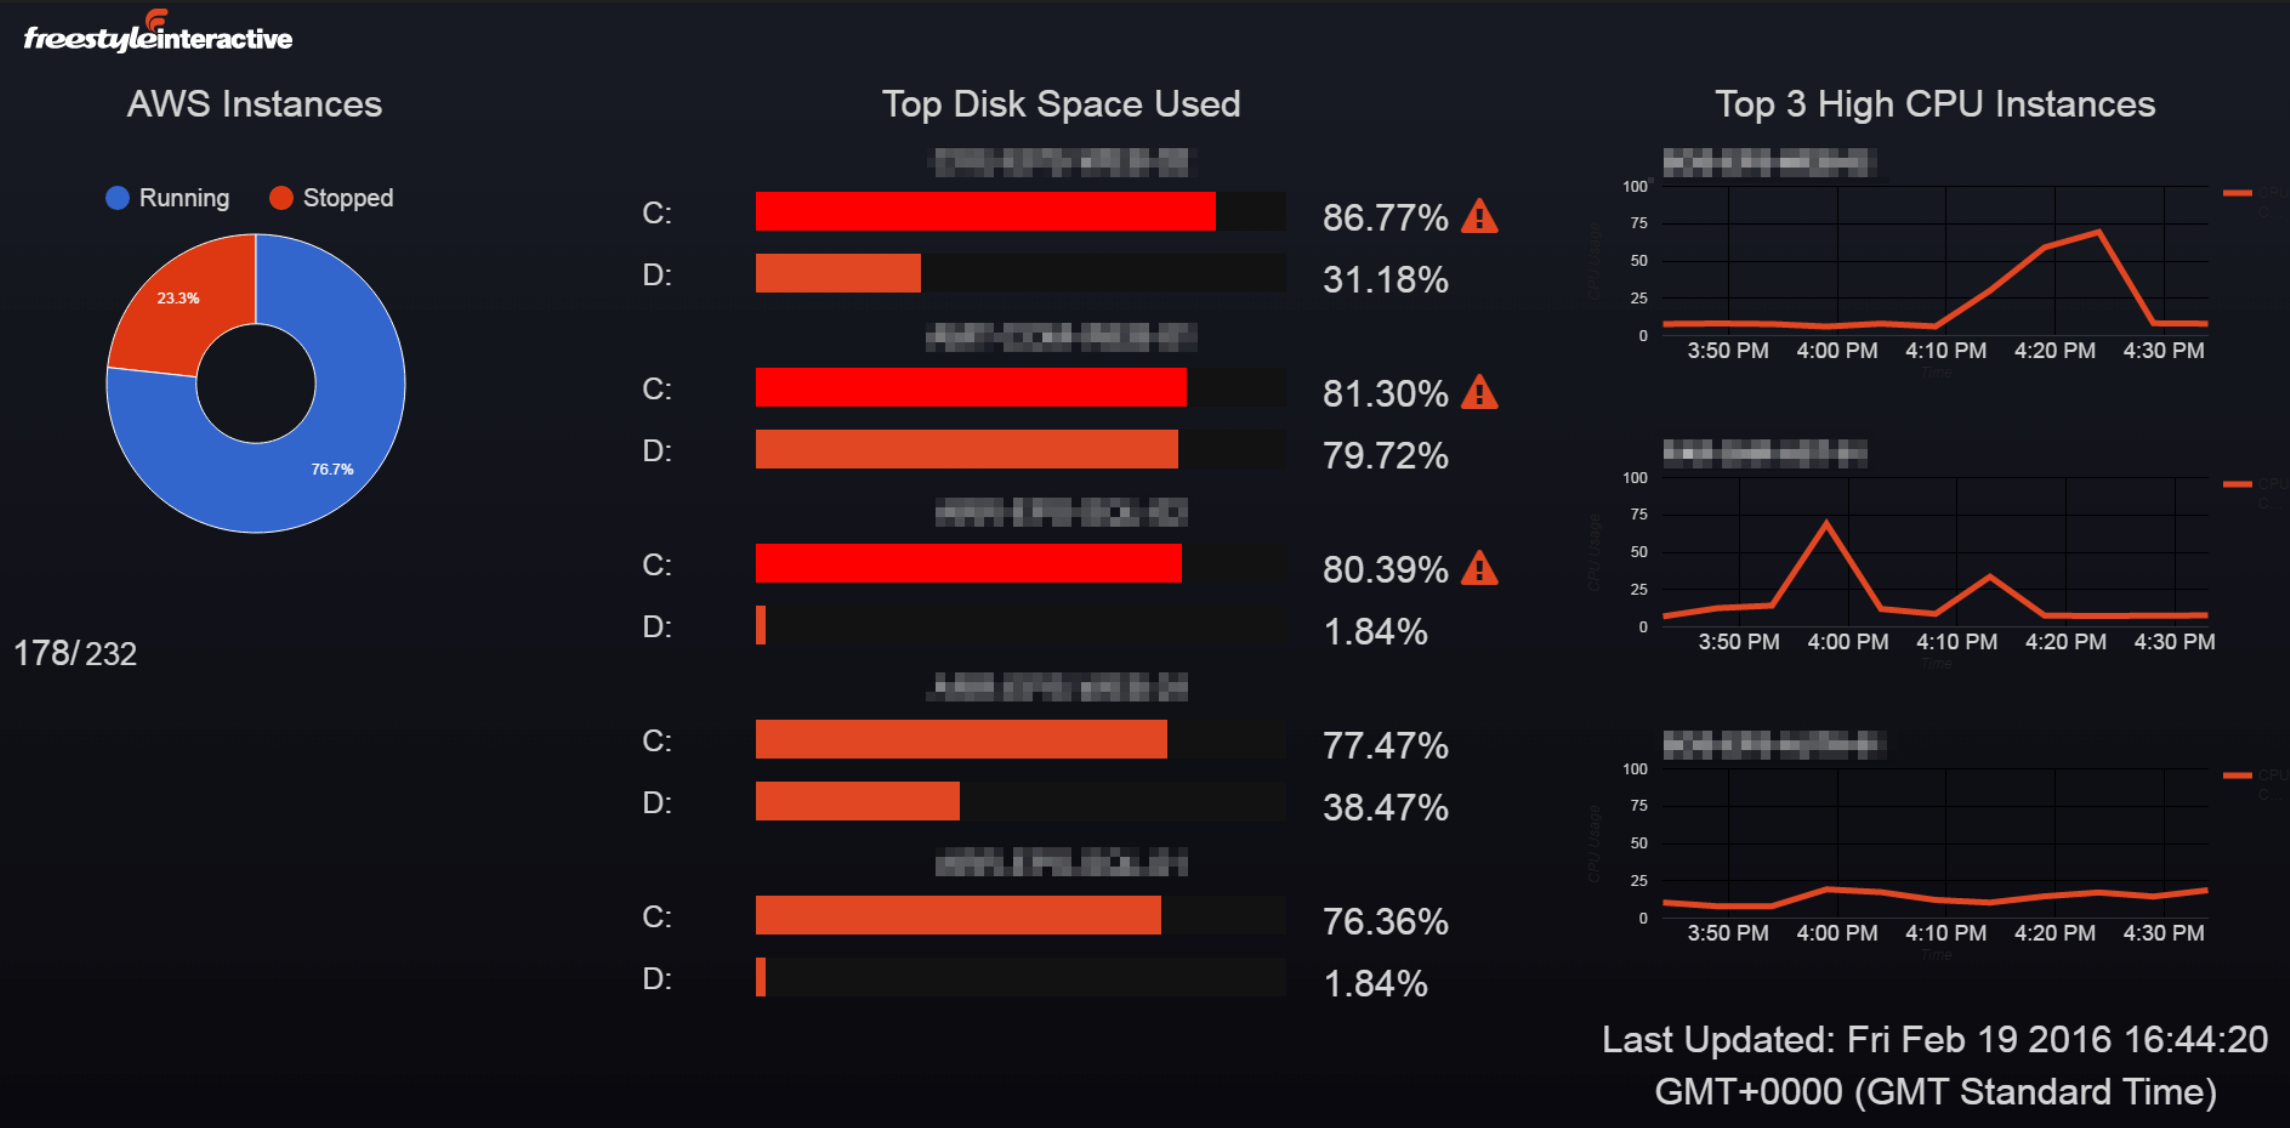
These are where the metrics we get from Amazon's CloudWatch service are displayed. We can see below that out of 232 instances we have in AWS, 178 of them are active. The rest have been turned off, because we don't need them at present. We can simply turn those back on when we do.
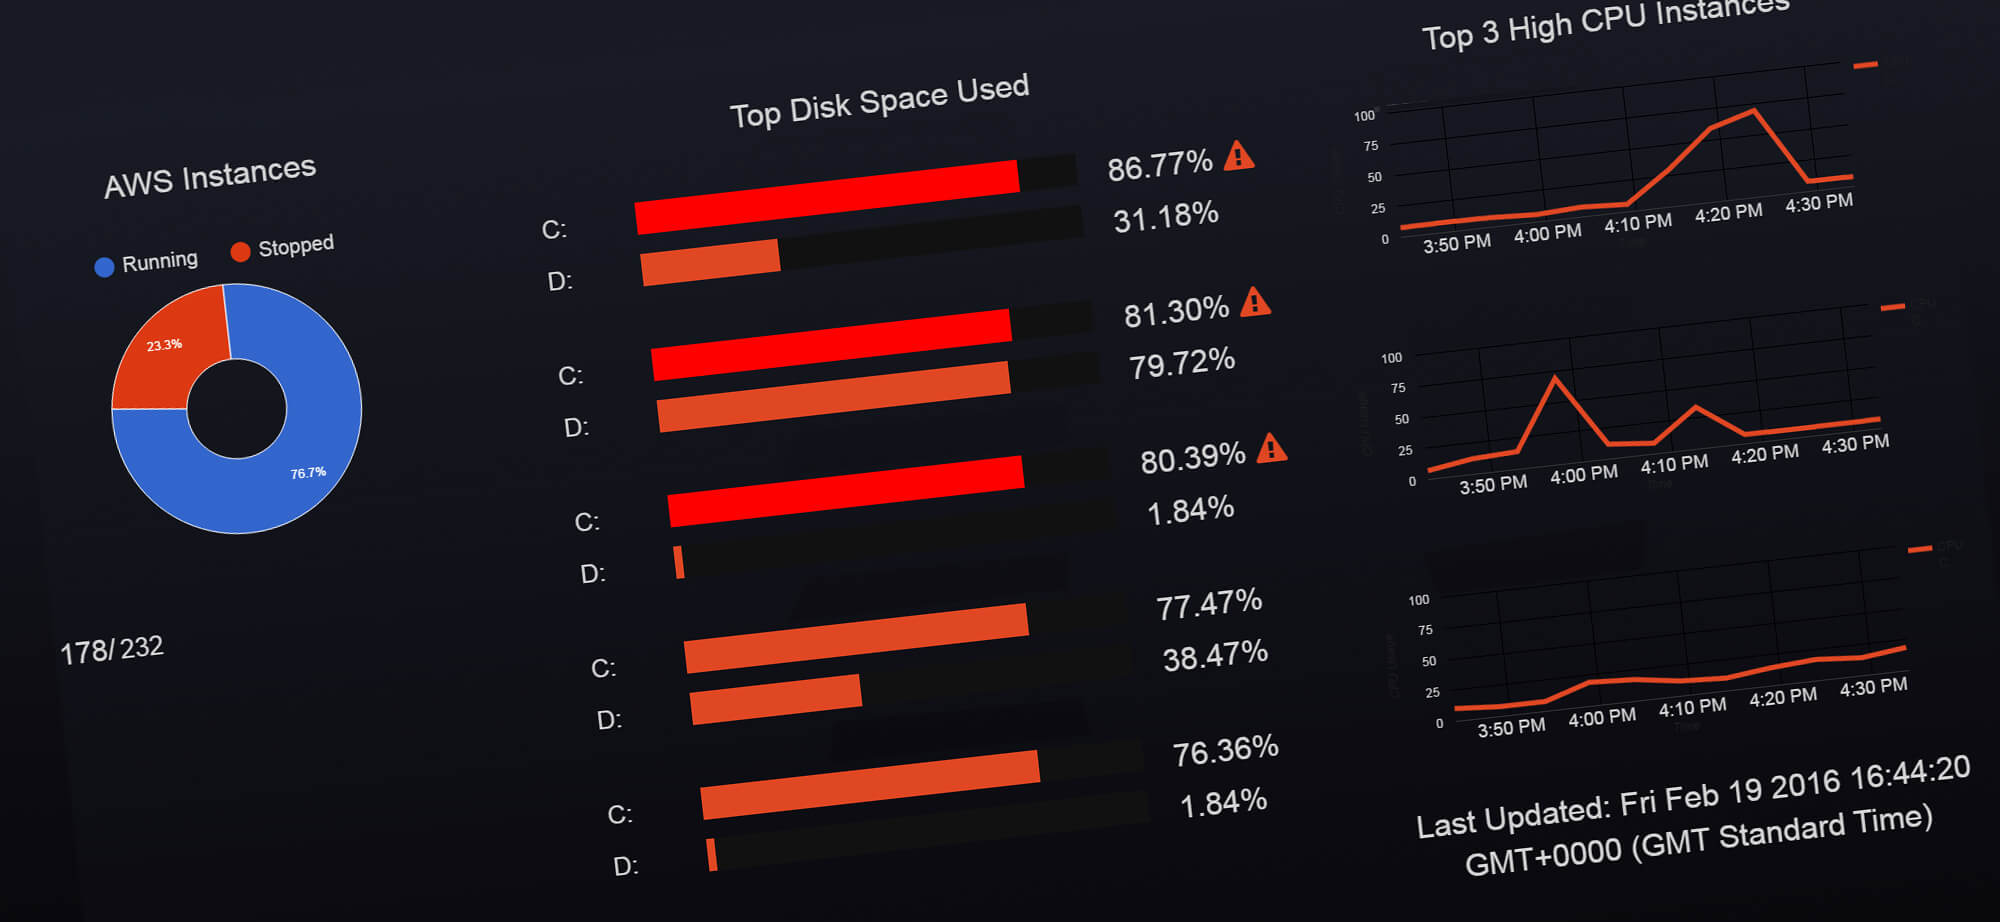
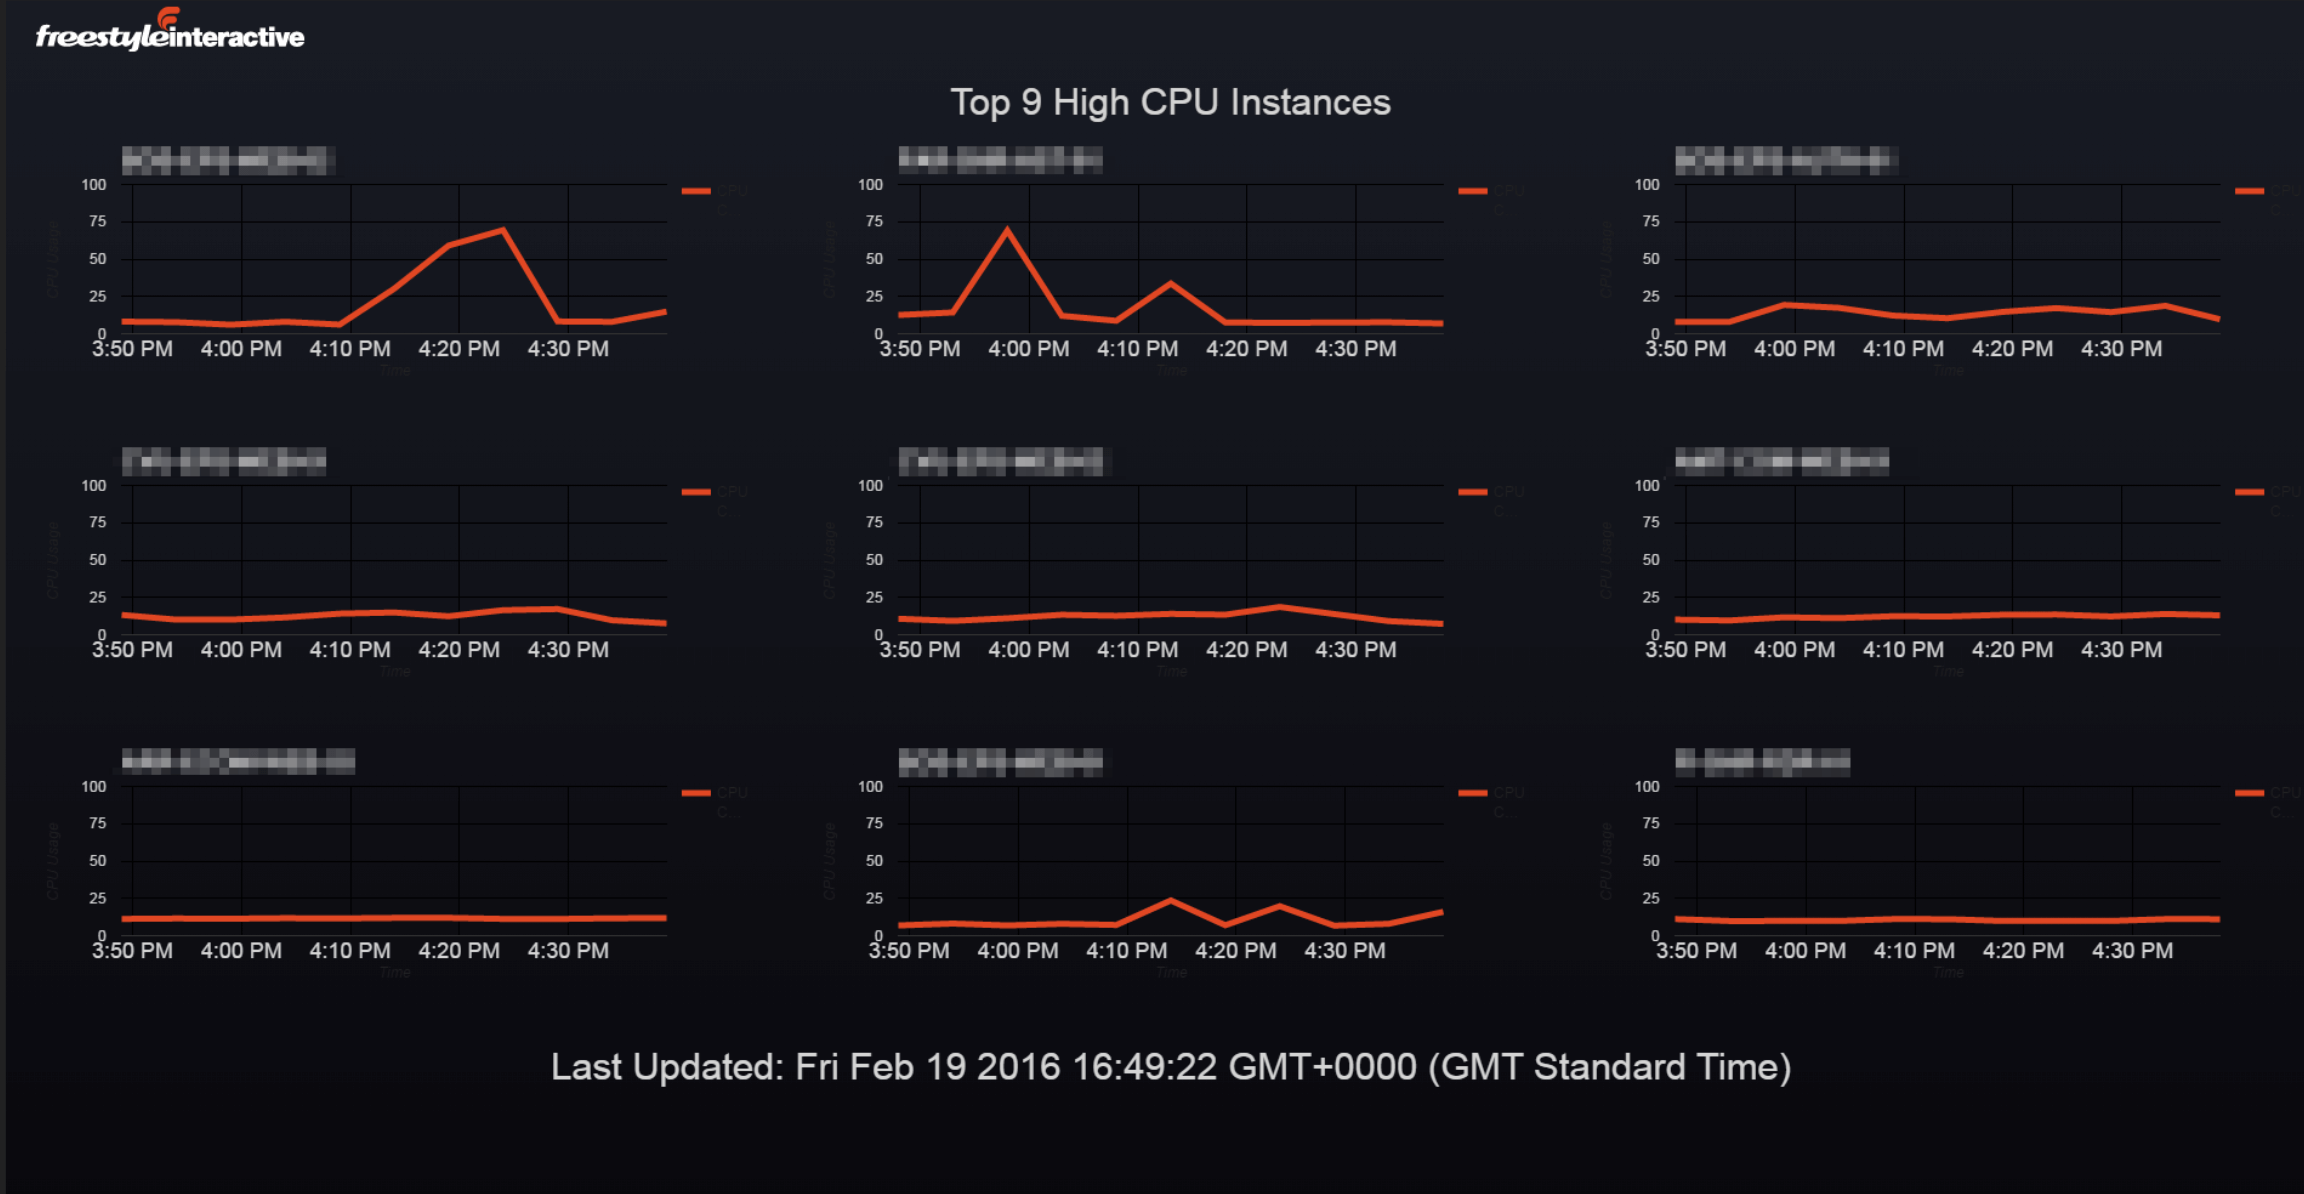
From this screen we can see the top 5 instances where disk space might be a problem (and therefore needs looking into), as well as the top 3 instances where CPU usage might be a problem. The next screen further expands the CPU graphs to the top 9 instances. This gives us an at-a-glance indication of where sites might be under-performing, or have other issues that need looking at.
The CruiseControl slide updates every 30 seconds, and the two AWS screens update every 5 minutes, to give us near real-time updates. If you'd like to learn more about continuous integration, or what constitutes best practice for any of the techniques we use involving software engineering, programming and development in general, get in touch, we'd be more than happy to chat.

New Business Director
Alan is Freestyle’s Founder and New Business Director. Get in touch with him for more information on the work we do, Freestyle Partners (DAM) and your upcoming project.